Visualization is made with p5.js. Live version reacting to mouse movement is available here.
Live editor is available here.
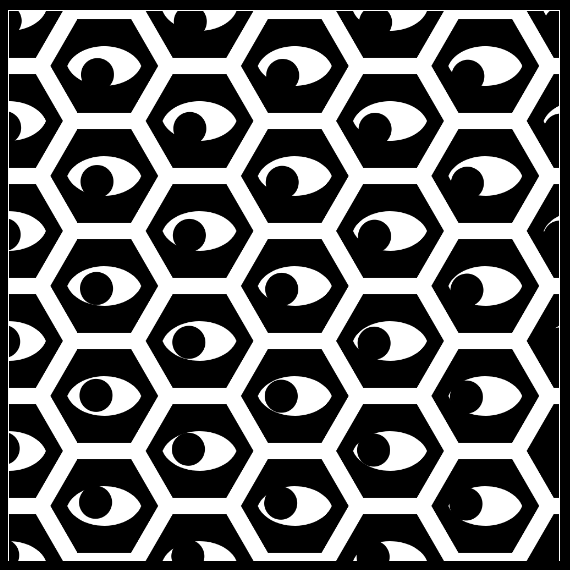
Mona Lisa Effect
Mona Lisa Effect, is the feeling that no matter where you move in relation to a figure in an artwork, the eyes in the image follow you. In case of this visualization, it is not only a feeling.
Code
This visualization is made with p5.js. Those are the two artworks, that inspired this visualization:
The Hexagon
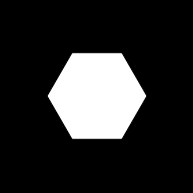
For this sketch, hexagon is drawn using drawHexagon(). Live example is available here.
function drawHexagon(x, y, radius) {
  beginShape()
  for(i = 0; i < 6; i++) {
    vertex(x + radius*cos(PI/3*i),y + radius*sin(PI/3*i))
  }
  endShape(CLOSE)
}
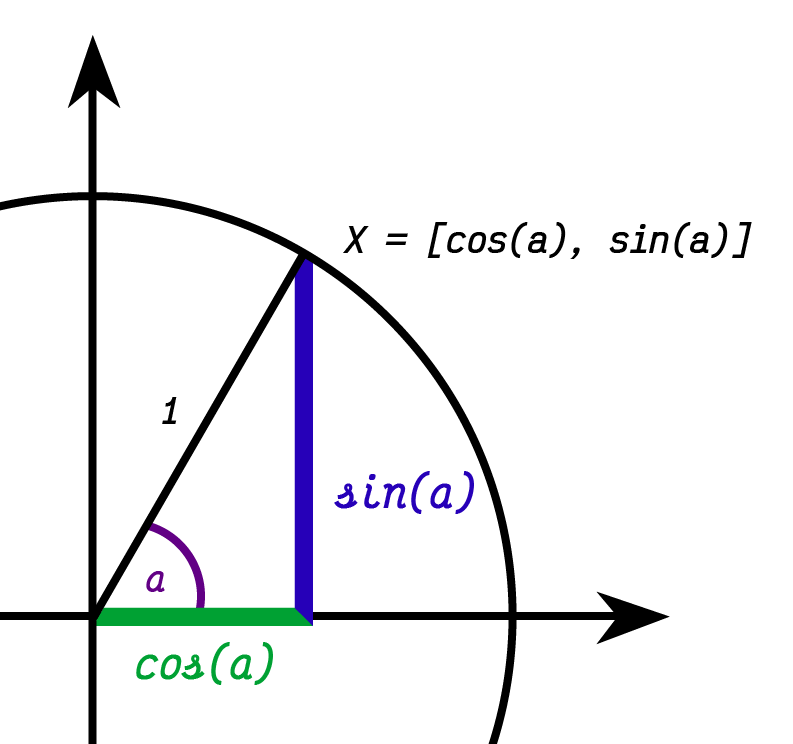
The code1 can be explained using the unit circle. In it, the position of the point on the circle is determined by the angle like this: $x=[cos(\alpha), sin(\alpha)].$
Hexagon is regular polygon with 6 sides. The angle of each side is $\frac{360°}{6}=60$ degrees, or $\frac{2\pi}{6}=\frac{\pi}{3}$ radians.
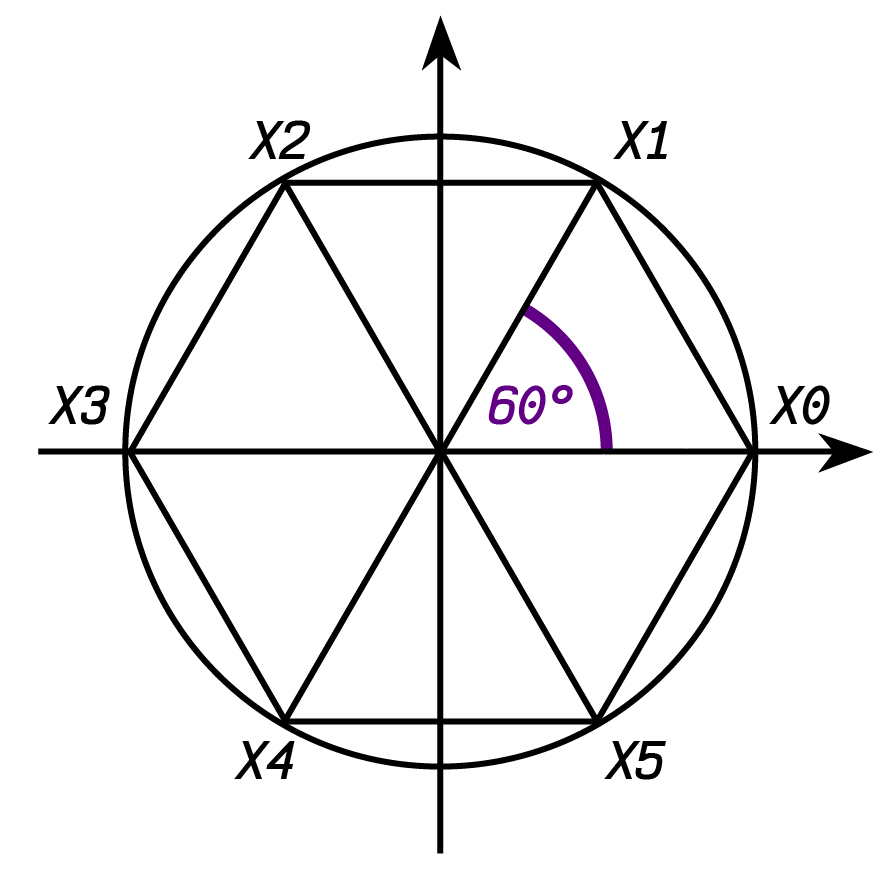
Therefore, the points of hexagon can be expressed as:
$$x_i = [cos(i*\frac{\pi}{3}), sin(i*\frac{\pi}{3})].$$
The Eye
Live version of the eye is availible here.
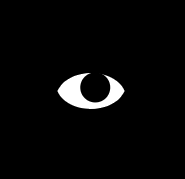
The Eyelids
The eyelid shape is drawn using two p5.js arc()2.
function drawEyelids(x,y) {
   off=PI/15
   arc(x, y-7, 70, 50, 0+off, PI-off)
   arc(x, y+7, 70, 50, PI+off, TAU-off)
}
The Iris
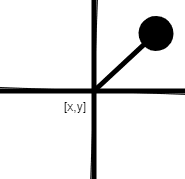
The iris is drawn with a circle. Instead of determining its position, the canvas is shifted to the center of the eye. Then, the angle between the center of the eye and the mouse position is calculated using $atan2(y,x)$.
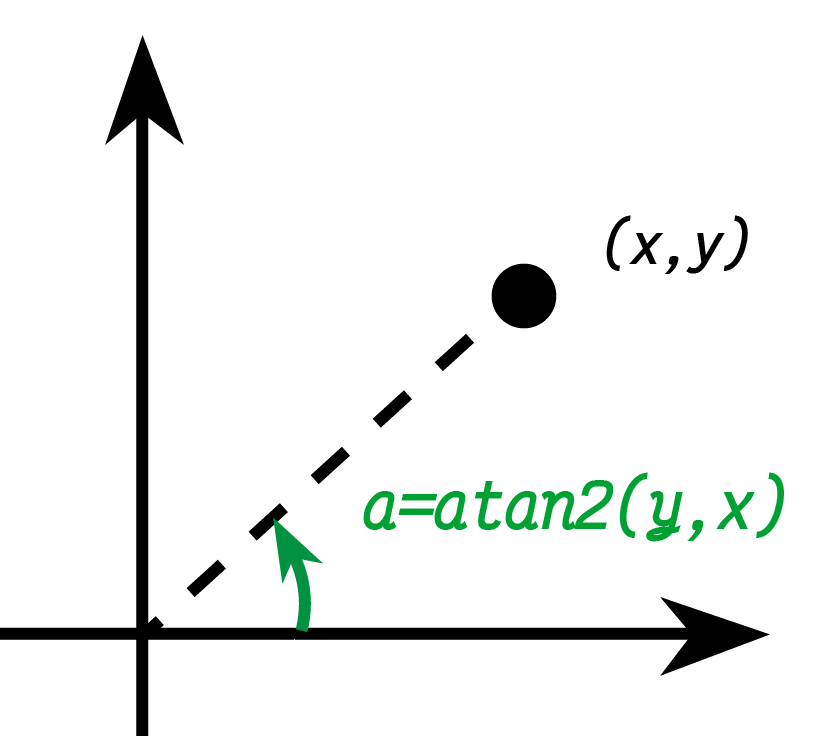
Then, the whole canvas is rotated by that angle. The distance between mouse and the center of the eye is used to determine how far the iris should be drawn. Functions push() and pop() are called to save and restore the state of the canvas. Without using those functions, the translations and rotations would stack up later.
function drawEyes(x, y) {
  push()

  // shift to given coordinates
  translate(x, y)

  // get distance position from point [x,y]
  let distance = dist(x, y, mouseX, mouseY)

  // map distance with bounds being [0,500] to lenght [0,10]
  let mappedDistance = map(distance, 0, 500, 0, 10)

  // get vector to the mouse
  let v2 = createVector(mouseX - x, mouseY - y)

  // get angle between vector and center of the eye and rotate canvas
  let angle = atan2(v2.y, v2.x) + PI/5
  rotate(angle)

  // draw iris on the coordinates of mapped distance
  circle(mappedDistance, mappedDistance, 30)
  pop()
}
This example can maybe make it easier to illustrate.
Complete visualization
Visualization is using functions drawHexagon(), drawEyes() and drawEyelids() described above. Shapes are drawn to form a hexagon grid.
function draw() {
 let s = sqrt(3)

 for(h = 0; h < W+100; h += 50) {
   for(w = -h*s; w < W+100; w += 100*s) {
     stroke(255)
     strokeWeight(15)
     drawHexagon(w,h,100/s)

     noStroke()
     fill(255)
     drawEyelids(w,h)

     fill(0)
     drawEyes(w,h);
   }
 }
}
-
P5.js does not require to declare variable names. ↩︎