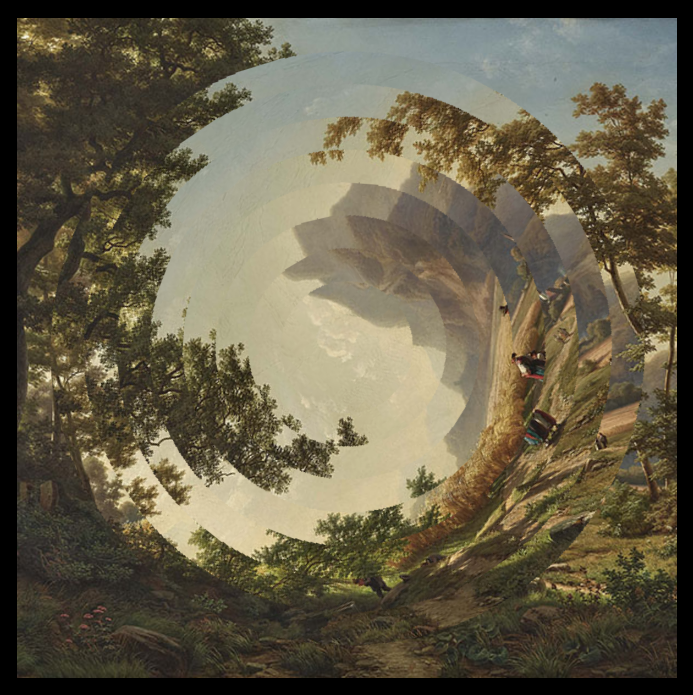
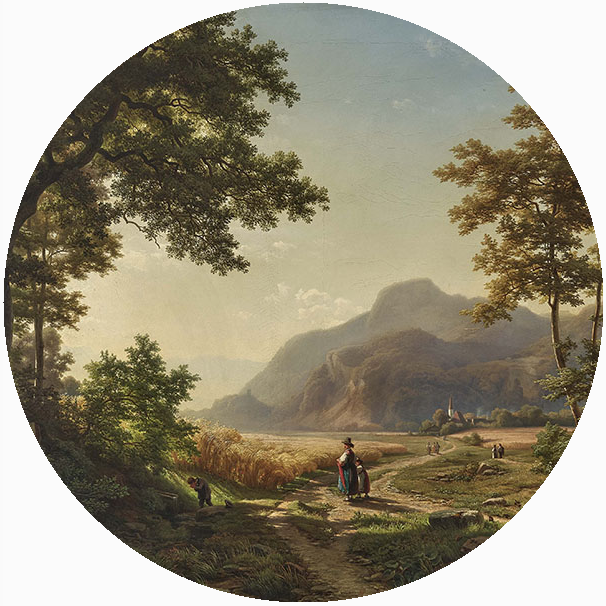
Visualizations are inspired by brilliant japanese artist Kensuke Koike. Two visualizations were made using web technoliges. This text is containing an explanation how was those visualizations made. An image used is from Johann (Hans) Beckmann, the name of the painting is Im Inntal.
The visualizations
| Circles | Penrose |
|---|---|
| Visualization Circles was made with p5.js. | Visualization Penrose was made with three.js. |
|
|
| Live version | Live version |
| Online editor | Online editor |
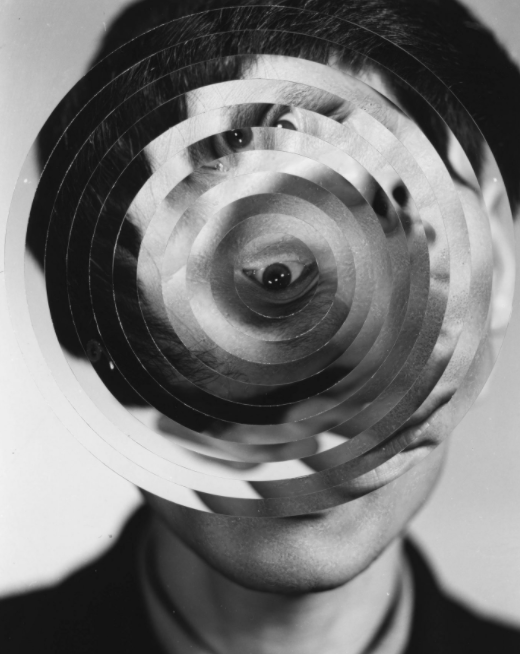
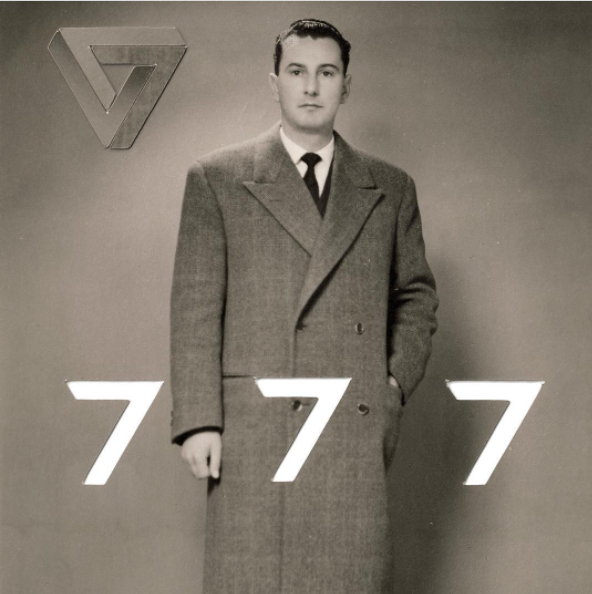
The inspiration
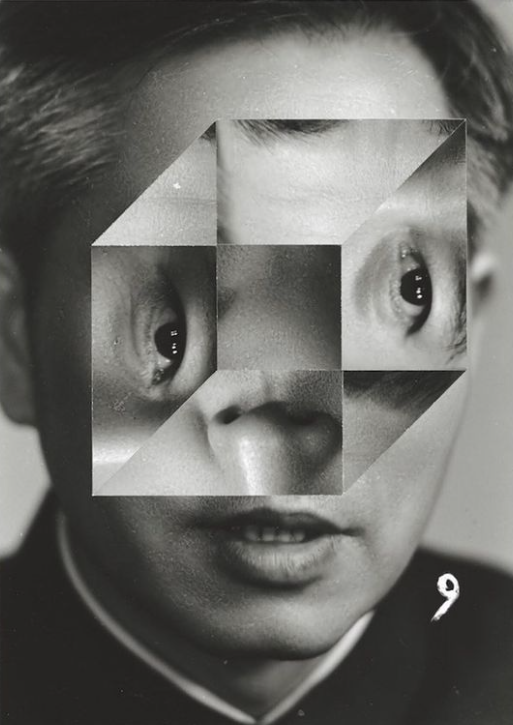
Kensuke Koike is famous for creative manipulations with real life printed photographs (especially black and white). His work can be found for example on Instagram. On the following pictures, the artworks that inspired the visualizations are shown.
|
|
|
Circles
In this example, the color of each square is defined by its distance from the center. If the $[x,y]$ coordinate is greater than given radius $r$, square is colored grey. This condition in math terms looks like this: $x^2+y^2 > r^2$.
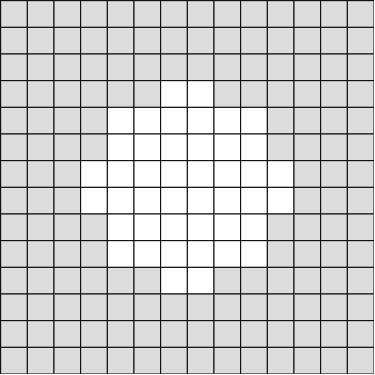
This principle is used for cutting off the alpha channel of an image, resulting in image drawn with given radius.
The code
The image is preloaded using built-in preload() function. This function is called before setup() function. In setup() function, noLoop() is called. This makes, the draw() function called just once.1
let WIDTH = 400;

function preload() {  img = loadImage('img/2.jpg'); }
function setup() {
  createCanvas(WIDTH, WIDTH);
  noLoop();
}
Each pixel has four values. Red, green, blue and alpha (this channel we want to manipulate). Values of pixels are stored in 1D array. Function drawImage() is checking each pixel and if it is greater than given radius, it sets the alpha channel to zero. Then it draws the image.
function drawCircle(radius) {
  for (let y = -WIDTH/2; y < WIDTH/2; y++) {
    for (let x = -WIDTH/2; x < WIDTH/2; x++) {

      // index of pixel is defined by x and y coordinates
      let index = x+WIDTH/2 + (y+WIDTH/2) * WIDTH

      // for every pixel, 4 values are stored so index needs to multiply index by 4
      index *= 4;

      // if the distance from center is greater than radius set alpha to 0
      if(pow(x,2)+pow(y,2) > pow(radius, 2)) {
        img.pixels[index+3] = 0;
      }
    }
  }

  // if we manipulate image pixels, updatePixels() has to be called
  img.updatePixels();
  image(img, -WIDTH/2, -WIDTH/2);
}
Then draw() function is called. In it, the canvas is shifted so that the origin is located in the middle. In default p5.js coordinate system, the $[0,0]$ is located in the top left corner. Then the background image is drawn.
Image circles are then drawn within a for loop. For each iteration, the radius is increased by 30. In each iteration, the canvas is rotated by 12 degrees using the rotate() function. Degrees are converted to radians using radians() function.
function draw() {
  // loadPixels() has to be called before drawing an image
  img.loadPixels();

  translate(W/2, W/2);
  image(img, -W/2, -W/2);
  img.updatePixels();

  for(i=W-330; i>0; i-=30) {
    rotate(radians(12));
    drawCircle(i);
  }
}
The result and code is available at p5 editor. Another visualization is trying to take a diffrent approach.
Penrose triangle
There is not only one way to determine the coordinates of the Penrose triangle points. In this section will be explained the method used in the visualization.
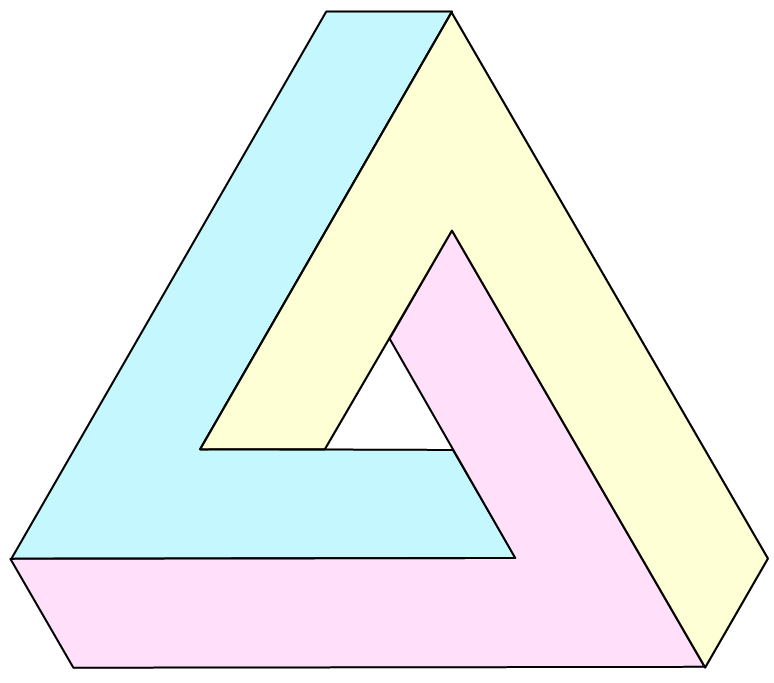
The idea here is to divide the penrose triangle into three shapes (yellow, cyan, pink) and get their coordinates.
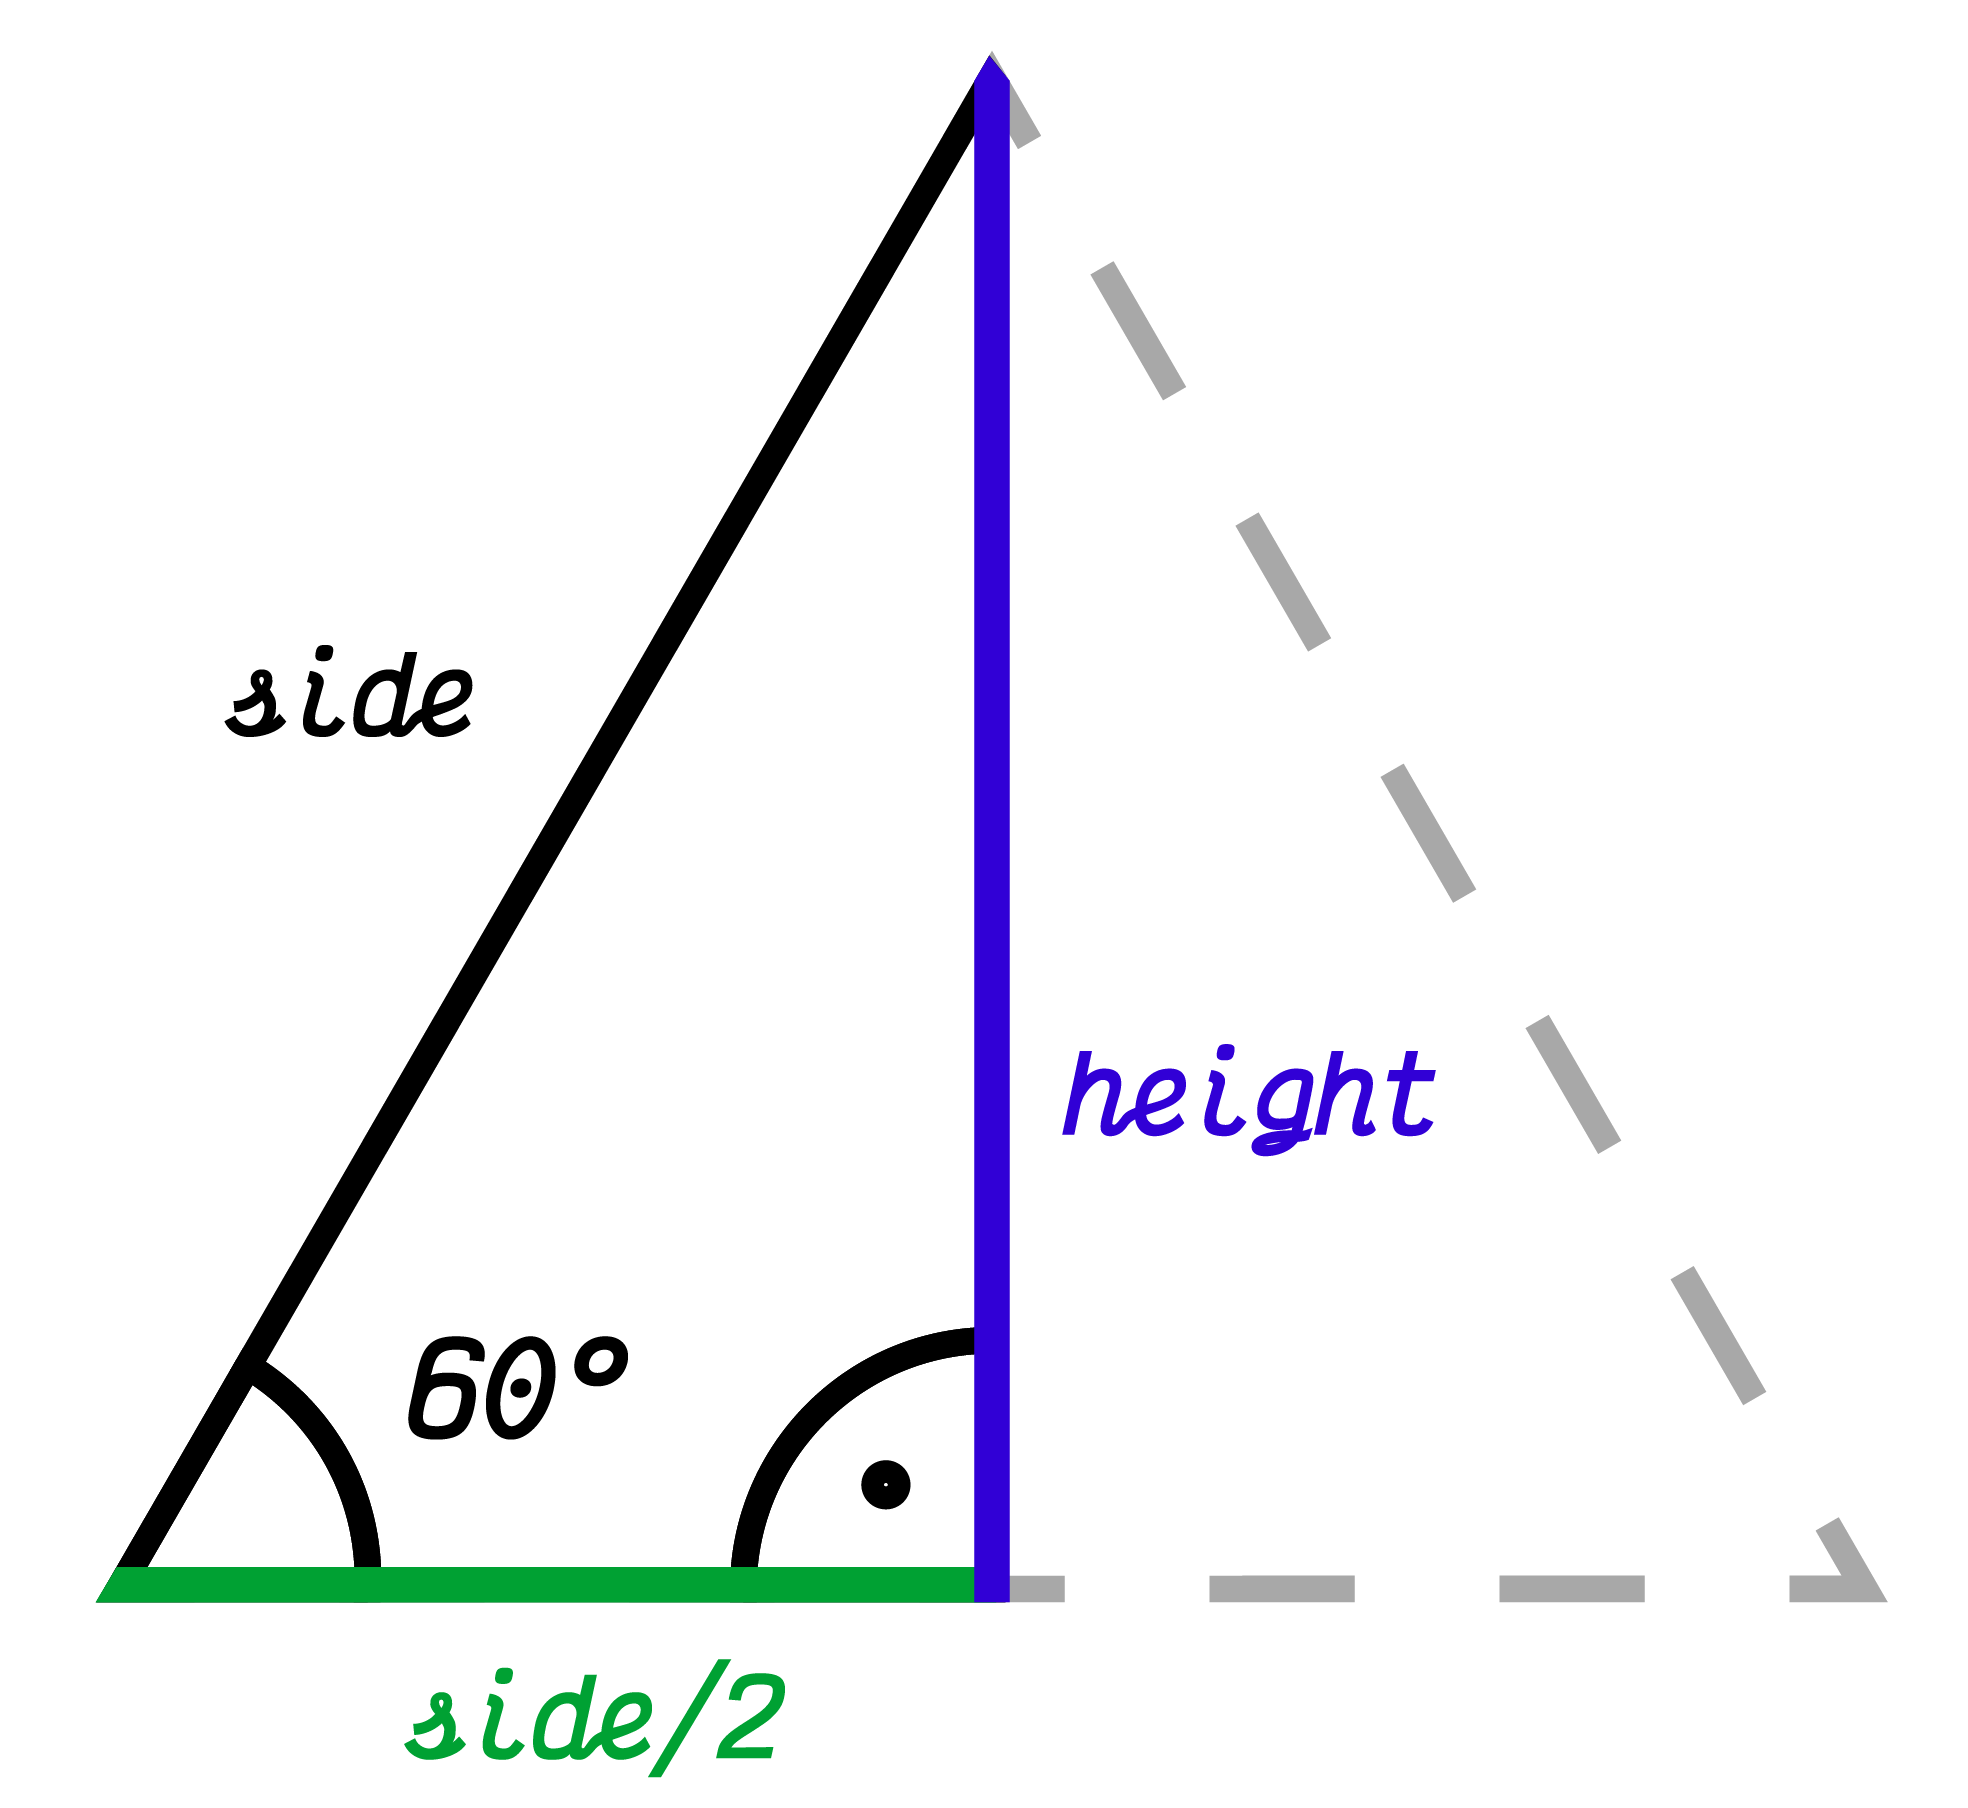
First, we define the height of the triangle.2 The sum of all angles in any thiangle is 180 degrees. This triangle is equilateral and therefore all the angles has $180/3 = 60$ degrees. Using goniometric functions we express the height using a side of the triangle:
$$ tan(60\degree ) = \frac{h}{s/2} $$ $$ h = \frac{s}{2} * tan(60\degree ) $$ $$ h = s* \frac{\sqrt{3}}{2}.$$
For the inner triangle of the Penrose triangle, points $A$, $B$, $C$ and vectors $u$, $v$, $w$ were defined3 as:
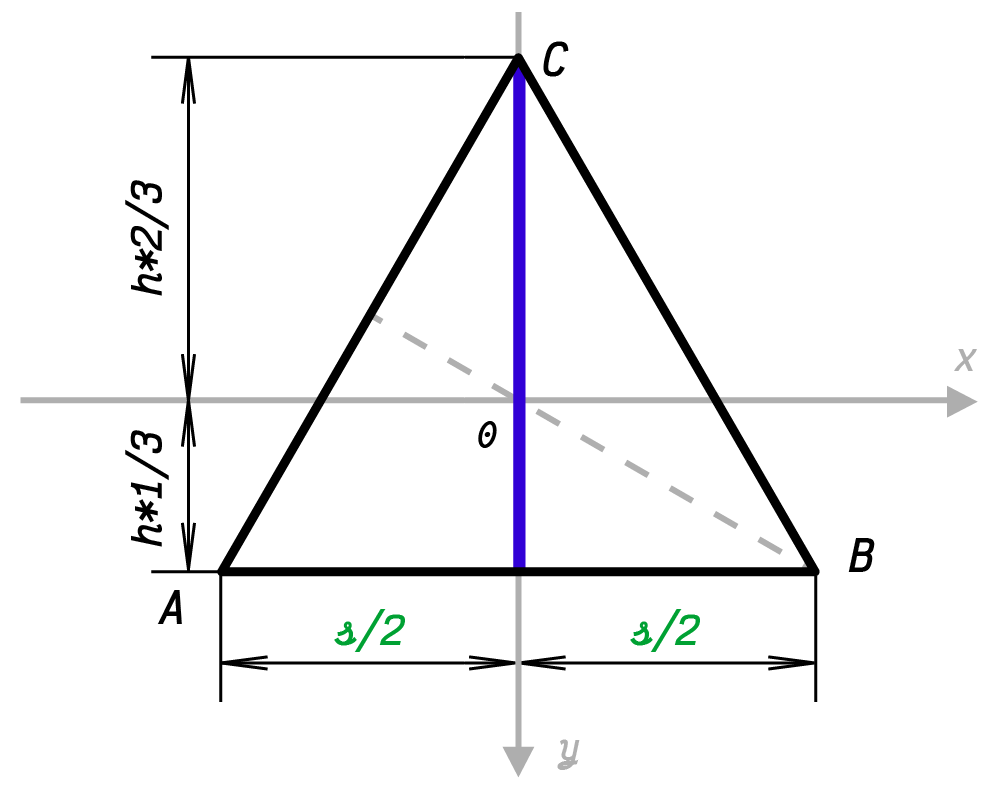
$$ (A,B,C) = ([ -\frac{s}{2}, h*\frac{1}{3} ], [ \frac{s}{2}, h*\frac{1}{3} ], [ 0, -h*\frac{2}{3} ])$$
$$ (u,v,w) = ([ B - A ], [ C - B],[ A - C ] ).$$
Then, the coordinates for grayed shape ($x_1$, $x_2$, $x_3$, $x_4$, $x_5$, $x_6$) were expressed as a combination of vectors $u$, $v$, $w$.
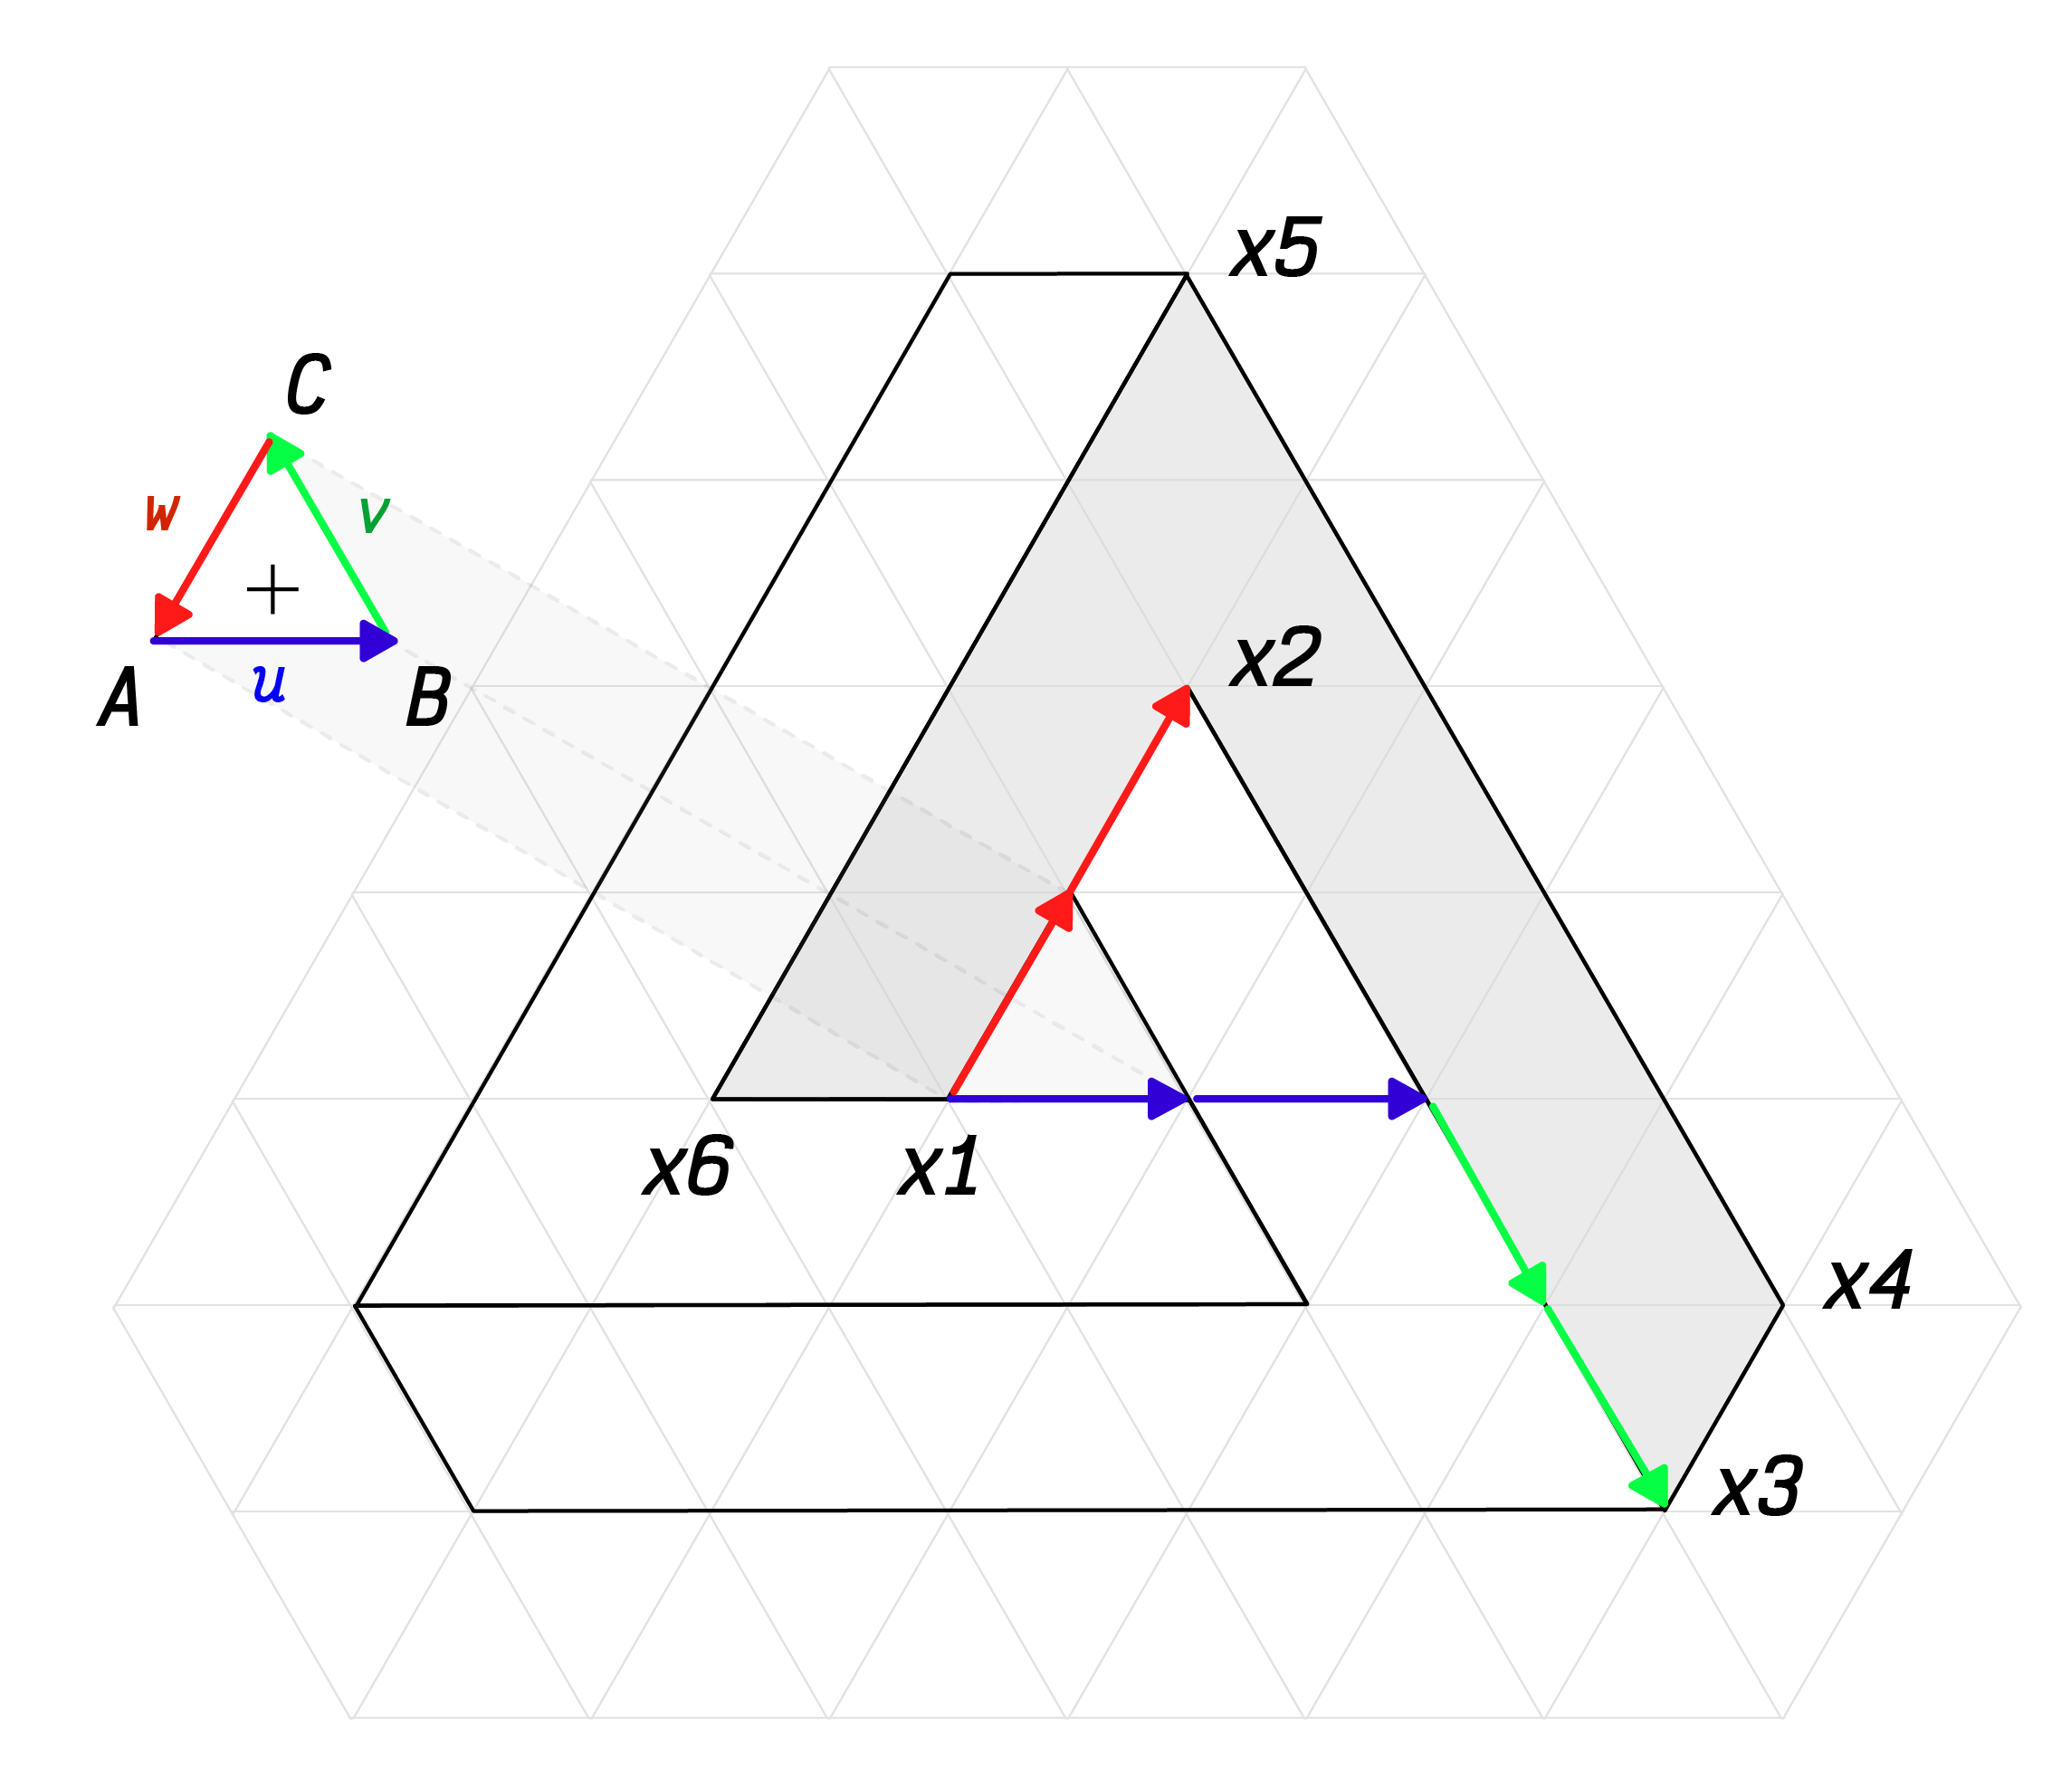
For every $x_i$ coordinate, the origin was shifted to the point $A$.
x1 = A
x2 = A +   0  * u +   0  * v +  (-2) * w
x3 = A +   2  * u + (-2) * v +    0  * w
x4 = A +   3  * u + (-1) * v +    0  * w
x5 = A +   0  * u +   1  * v +  (-3) * w
x6 = A + (-1) * u +   0  * v +    0  * w
This is just an example of linear combination, that is generating this shape. There are more ways this points could be obtained.
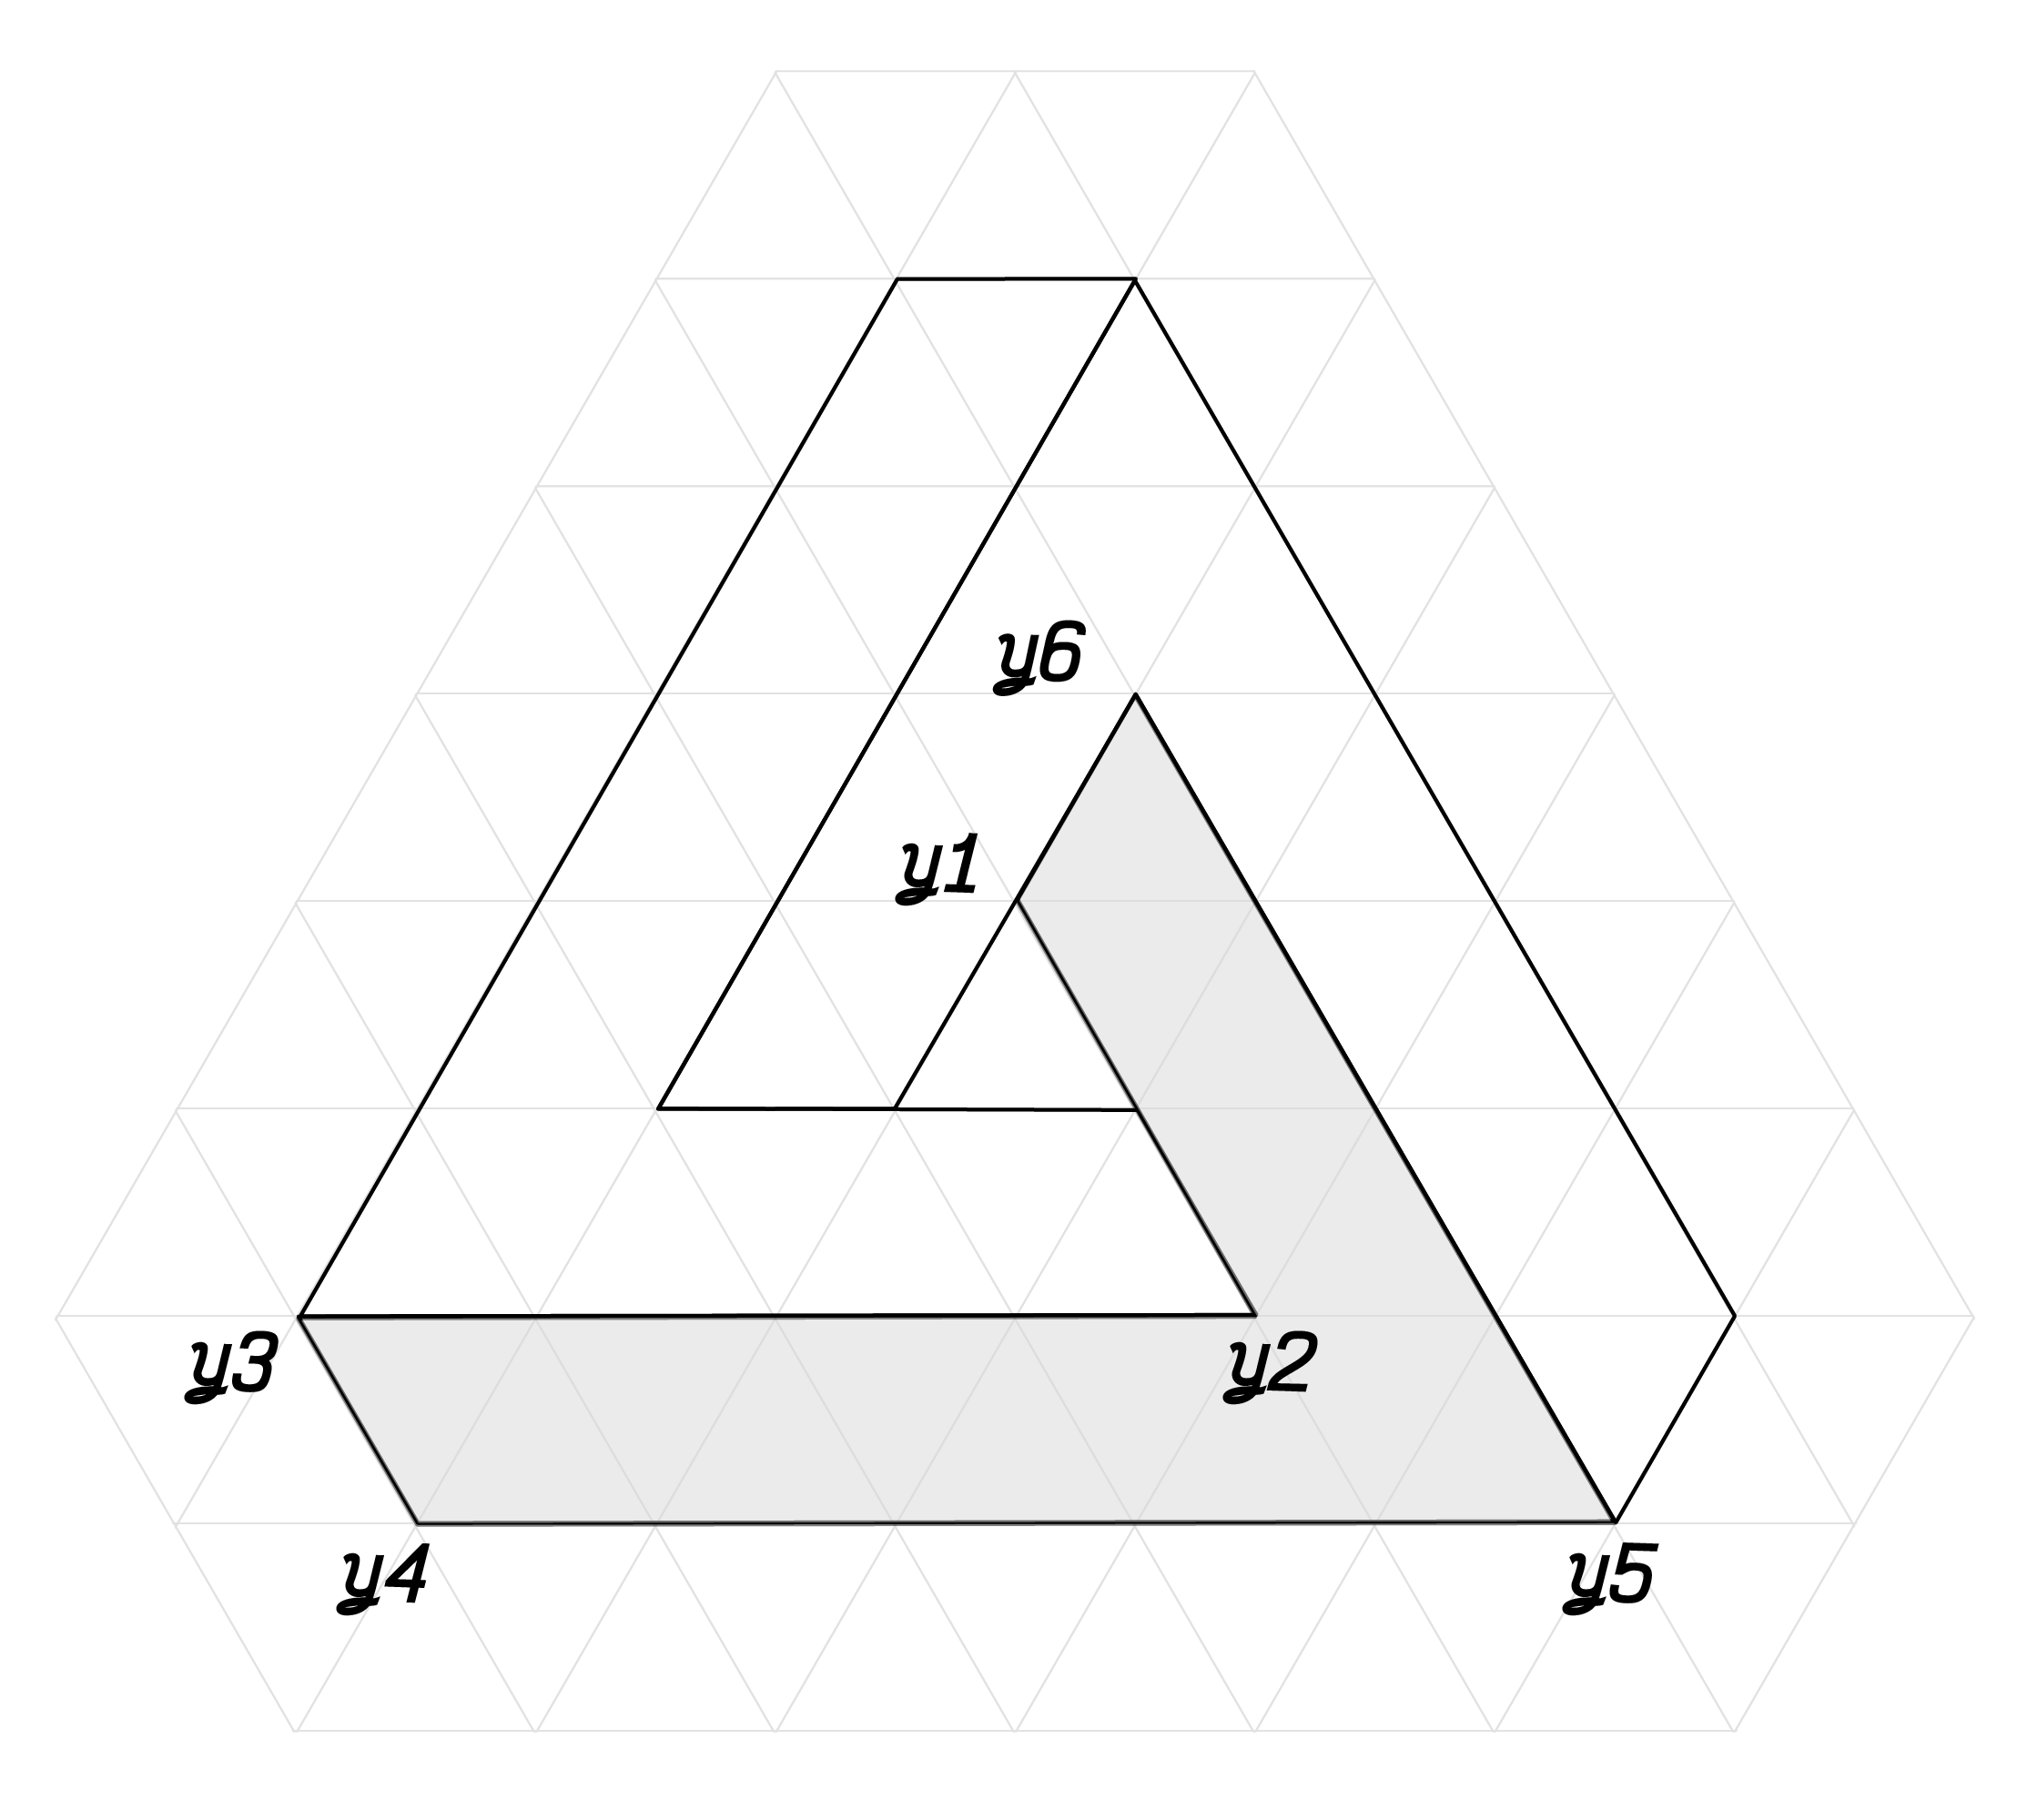
The next step is to generate the remaining two shapes. Those can be done using the same linear combination as before, but using the vectors $u$, $v$, $w$ in different order and thus performing a rotation. An example of another shape:
y1 = C
y2 = C +   0  * w +   0  * u +  (-2) * v
y3 = C +   2  * w + (-2) * u +    0  * v
y4 = C +   3  * w + (-1) * u +    0  * v
y5 = C +   0  * w +   1  * u +  (-3) * v
y6 = C + (-1) * w +   0  * u +    0  * v
The coordinates for the third shape can be generated analogouslly. Thanks to this process, the coordinates of those three shapes forming Penrose triangle can be generated and parametrized by the side of the inner triangle.
Three.js
This code explains the Three.js implementation of the visualization. Coordinates are generated as was described above. Following code snippets are showing just specific part of the code.
// function creates one shape from given coordinates and adds a texture to it
function penrosePart(coordinates, image_path, scene) {
  // load texture
  let texture = new THREE.TextureLoader().load( image_path );

  // enable mirror wrapping
  texture.wrapS = THREE.MirroredRepeatWrapping;
  texture.wrapT = THREE.MirroredRepeatWrapping;

  // create texture material
  let textureMaterial = new THREE.MeshBasicMaterial( { map: texture } );

  // create geometry from coordinates
  let geomShape = new THREE.ShapeBufferGeometry( new THREE.Shape( coordinates ) );

  // create mesh and add to scene
  let mesh = new THREE.Mesh(geometry, material);
  scene.add(mesh);
}
The visualization is reacting to mouse movement (and touch event). Mouse (or touch) coordinates are used to offset the shape texture.
// edit texture offset on mouse move
function onDocumentMouseMove(event) {
  event.preventDefault();
  mouse.x = (event.clientX / window.innerWidth ) * 2;
  mouse.y = (event.clientY / window.innerHeight) * 2;
  shapeA.material.map.offset.x = positionX + Math.cos(mouse.x) * 0.3;
	shapeB.material.map.offset.y = positionY + Math.cos(mouse.y) * 0.3;
	shapeC.material.map.offset.x = positionX + Math.cos(mouse.y) * 0.3;
}
The resulting visualization and online code editor can be found here.
-
In case of this visualization, it is important to call
noLoop(), because it is computationally expensive. ↩︎ -
Font used in visual materials is Victor Mono. ↩︎
-
This definition is using p5.js coordinate system, which has positive values in the right down corner. ↩︎